Introduction:
Enzymes are the organic biological catalysts, which speed up the rate of biochemical reactions without undergoing any change.
They are specific to one type of reaction and one, or a small number of, closely related reactants known as substrates.
Enzyme kinetics is the study of enzyme reaction rates and the conditions which affect them.
In this lecture, we will discuss the Lineweaver–Burk Plot which gives us important information regarding the enzyme inhibition.
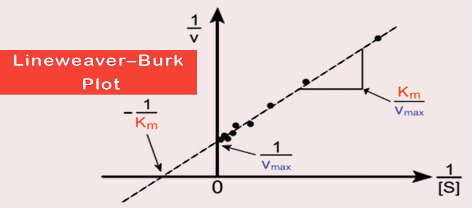
Lineweaver–Burk Plot.
Since, Vmax is achieved at infinite substrate concentration, it is impossible to estimate Vmax and hence Km from a hyperbolic plot.
To overcome this difficulty, the Michaelis–Menten equation was transformed into an equation for a straight line by Lineweaver and Burk.
The Lineweaver–Burk plot (or double reciprocal plot) is a graphical representation of the Lineweaver–Burk equation of enzyme kinetics, described by Hans Lineweaver and Dean Burk in 1934.
This plot is a derivation of the Michaelis–Menten equation and is represented as:

Where,
V is the reaction velocity (the reaction rate),
Km is the Michaelis–Menten constant,
Vmax is the maximum reaction velocity,
[S] is the substrate concentration.
It gives a straight line, with the intercept on the y-axis equal to 1/Vmax, and the intercept on the x-axis equal to Km/Vmax. The slope of the line is equal to Km/Vmax.
Vmax and Km can be determined experimentally by measuring V0 at different substrate concentrations. Then a double reciprocal or Lineweaver–Burk plot of 1/V0 against 1/[S] is made.
Reversible enzyme inhibitors can be classified as either competitive or noncompetitive, and can be distinguished easily via a Lineweaver–Burk plot.
It is a useful way of determining how an inhibitor binds to an enzyme.
Competitive inhibition can be recognized by using a Lineweaver–Burk plot if V0 is measured at different substrate concentrations in the presence of a fixed concentration of inhibitor.
A competitive inhibitor increases the slope of the line on the Lineweaver–Burk plot, and alters the intercept on the x-axis (since Km is increased), but leaves the intercept on the y- axis unchanged (since Vmax remains constant).
Noncompetitive inhibition can also be recognized on a Lineweaver–Burk plot since it increases the slope of the experimental line, and alters the intercept on the y-axis (since Vmax is decreased), but leaves the intercept on the x-axis unchanged (since Km remains constant).
Uses:
Used to determine important terms in enzyme kinetics, such as Kmand Vmax (Before use of advanced computers).
Provides a quick, information of the different forms of enzyme inhibition from the plot.
Commonly Asked Questions.
Explain Lineweaver–Burk Plot and give its uses.